In our last section, we discussed how we can use graphs on the Cartesian coordinate plane to represent ordered pairs, relations, and functions. In this section, we will dig into the graphs of functions that have been defined using an equation. Our first task is to work backwards from what we did at the end of the last section, and start with a graph to determine the values of a function.
To use a graph to determine the values of a function, the main thing to keep in mind is that \(f(input) = ouput\) is the same thing as \(f(x) = y\), which means that we can use the \(y\) value that corresponds to a given \(x\) value on a graph to determine what the function is equal to there. For example, if we had a graph for a function \(f\) and we wanted to use that to know what \(f(3)\) was, we would start at the origin (0, 0), then move along the horizontal axis to where \(x = 3\) and then move up or down until we hit the graph. The \(y\) value there is \(f(3)\).
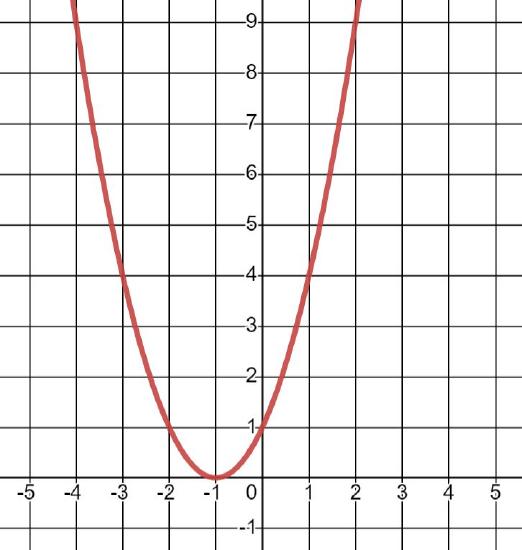
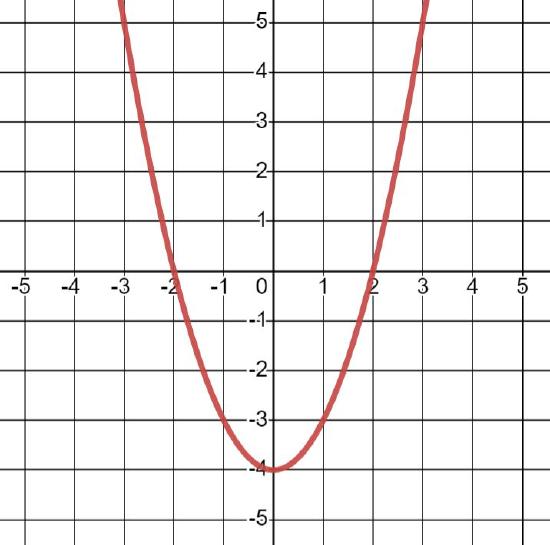
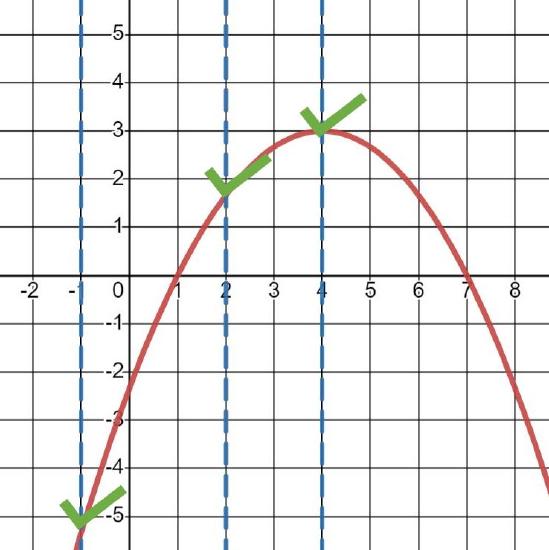
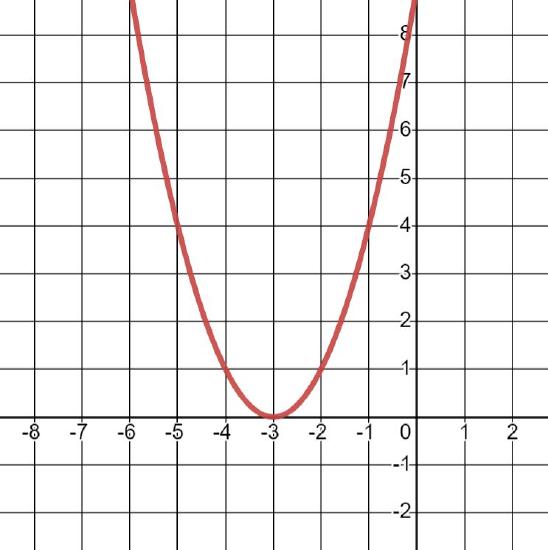
Use the graph below to determine the following values for \(f(x) = (x + 1)^2\):
After determining these values, compare your answers to what you would get by simply plugging the given values into the function.
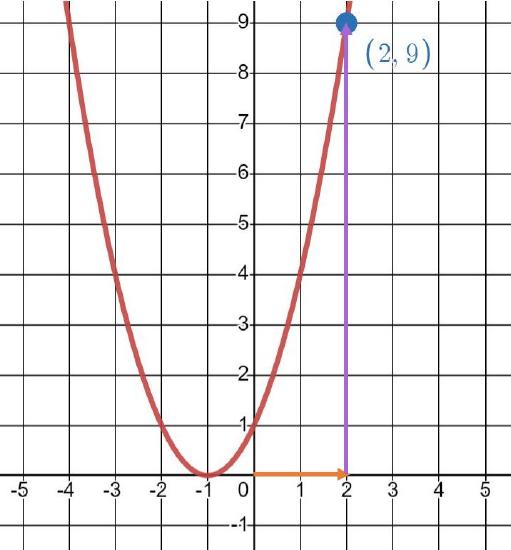
We can compare this answer to what we get by plugging 2 into \(f\). We have \(f(2) = (2 + 1)^2 = 3^2 = 9\); this agrees with the answer from the graph!
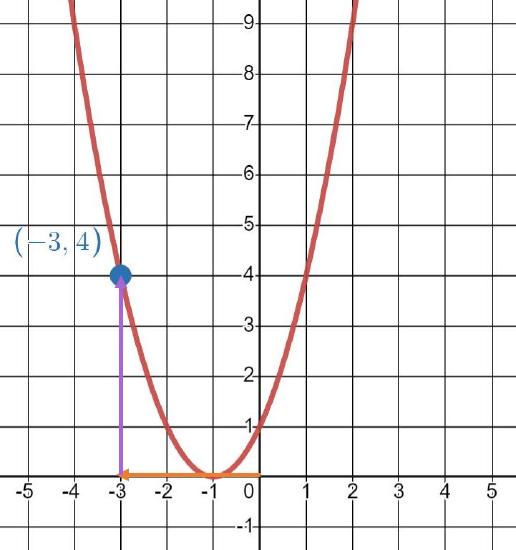
If we want to check our answer by just evaluating \(f(-3)\) by plugging in -3 for \(x\), we have \(f(-3) = (-3 + 1)^2 = (-2)^2 = 4\).
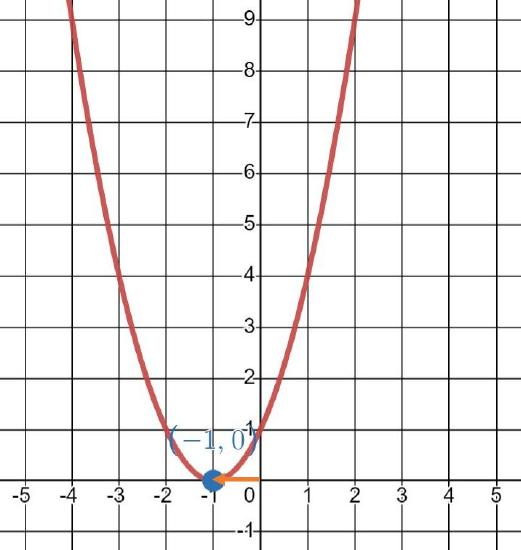
We can plug in -1; we get \(f(-1) = (-1 + 1)^2 = 0^2 = 0\).
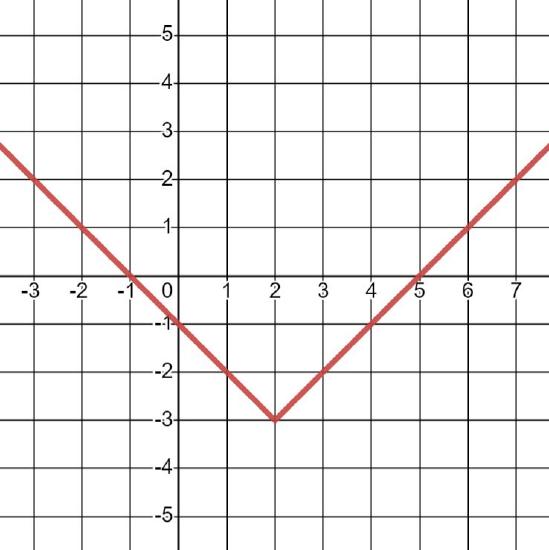
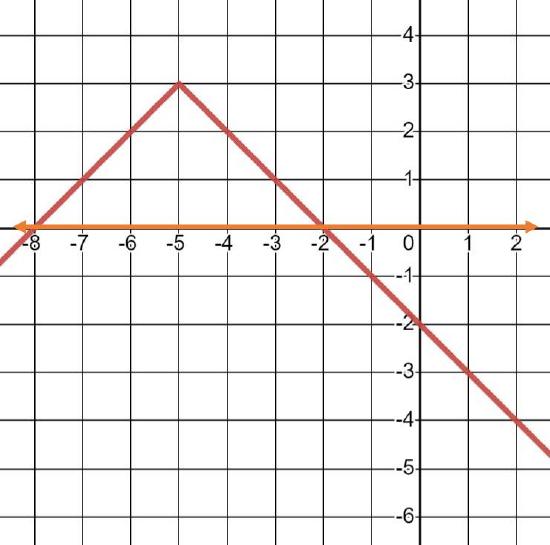
Use the graph below to determine the following values for \(f(x) = |x - 2| - 3\):
After determining these values, compare your answers to what you would get by simply plugging the given values into the function.
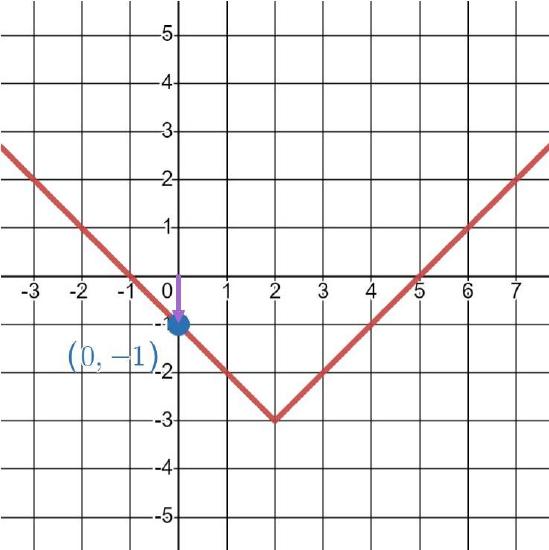
We can also just evaluate the function directly. Plugging in \(x = 0\), we get \(f(0) = |0 - 2| - 3 = |-2| - 3 = 2 - 3 = -1\).
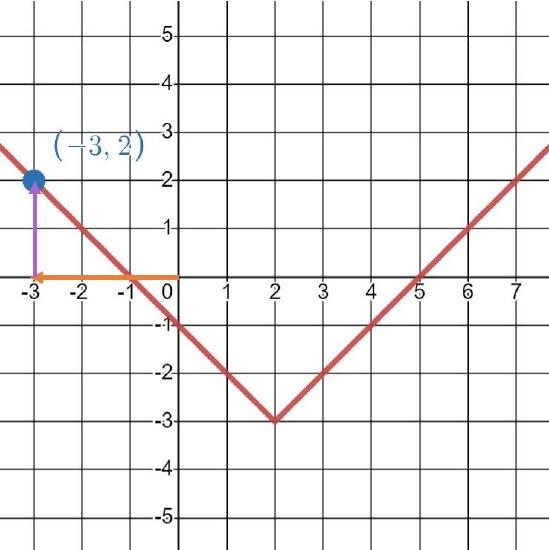
We can plug in \(x = -3\) to get \(f(-3) = |-3 - 2| - 3 = |-5| - 3 = 5 - 3 = 2\).
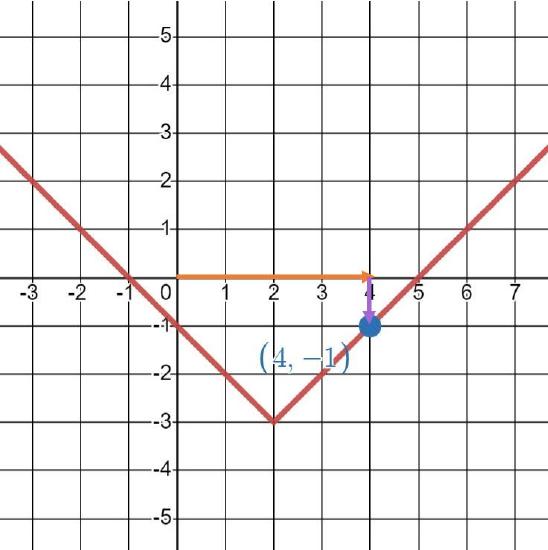
We can compare this answer to what we get by plugging in \(x = 4\). We have \(f(4) = |4 - 2| - 3 = |2| - 3 = 2 - 3 = -1\).
The examples above were graphs of functions, but in the last section we talked about graphing relations and not just functions. However, functions are going to be the focus of what we work with in this course so this brings us to an important question: how do we know if a graph represents a function?
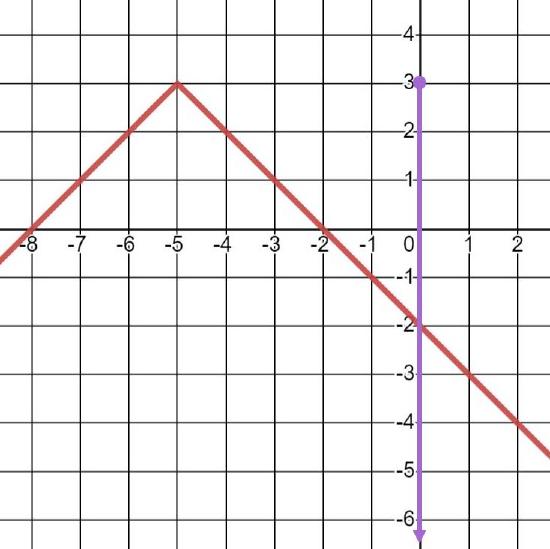
The big idea here lies in the definition of a function: each input (or \(x\) value) may have only one output (or \(y\) value). Based on this, we use what's called the vertical line test to determine if a graph represents a function or not. This test helps us identify from the graph of a function if there's anywhere that a single input may have two outputs.
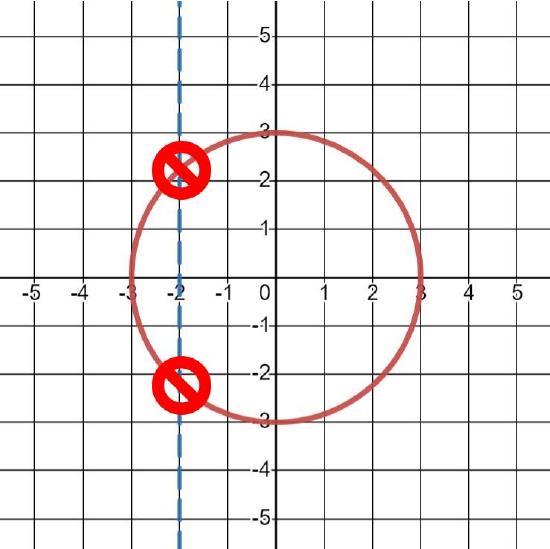
If a vertical line drawn anywhere on the graph of a relation only intersects the graph at one point, then that graph represents a function. If a vertical line can intersect the graph at two or more points, then the graph does not represent a function.
In other words, if a vertical line drawn anywhere only intersects the graph at only one spot, this means that each \(x\) value corresponds to only one \(y\) value, so the graph represents a function. If a vertical line can be drawn that intersects the graph at more than one spot, then this means that there is an \(x\) value that corresponds to multiple \(y\) values so the graph cannot represent a function.
Let's try this out on some examples!
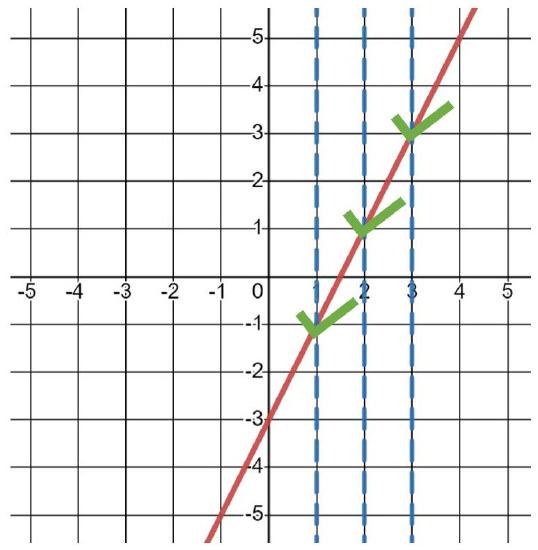
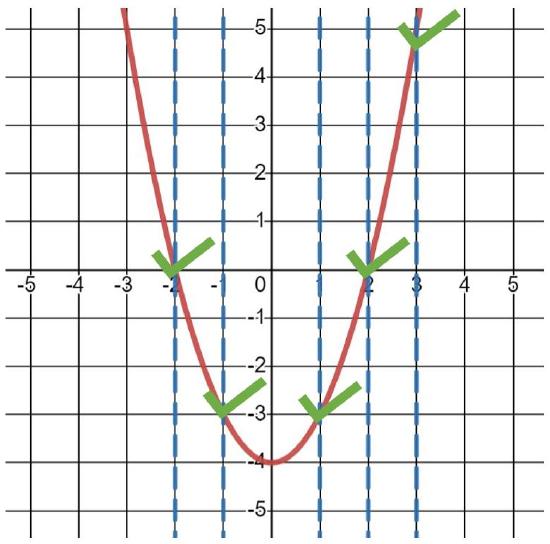
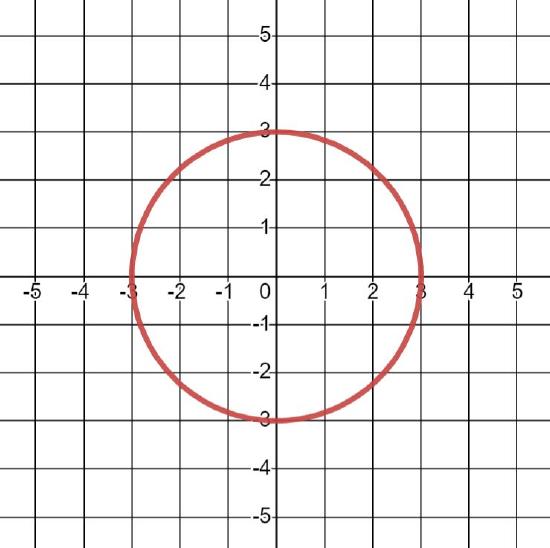
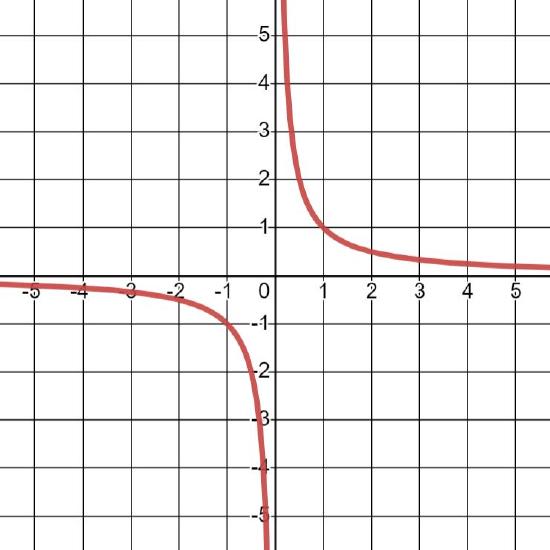
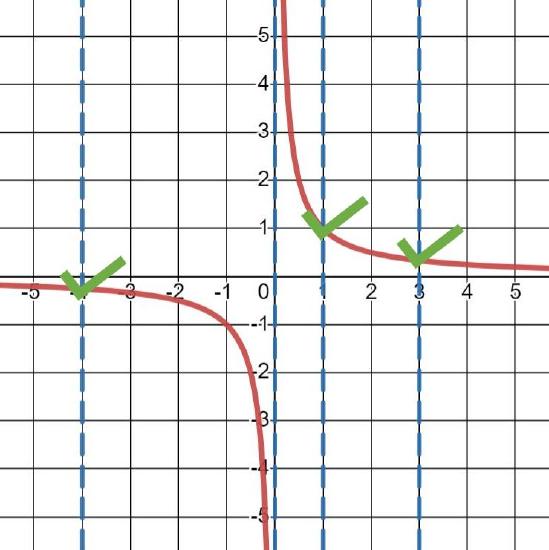
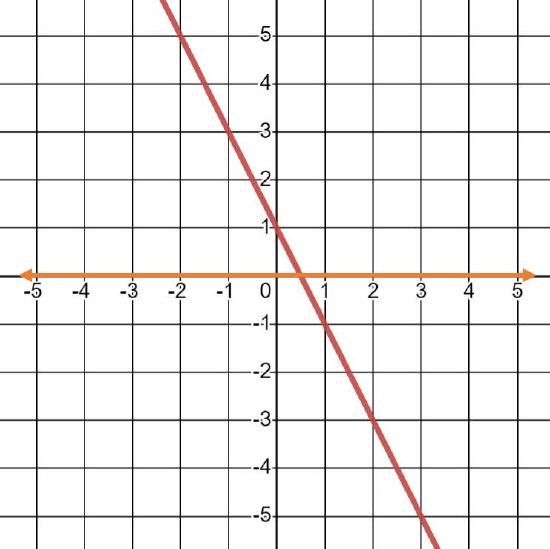
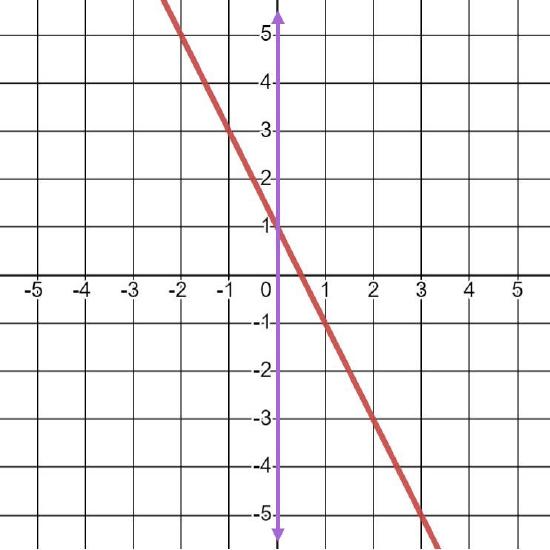
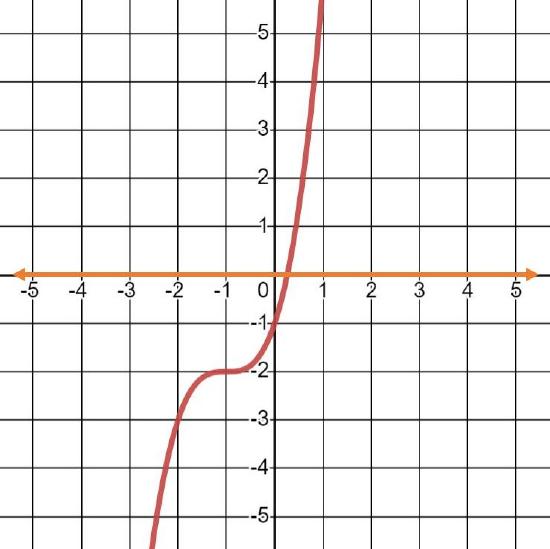
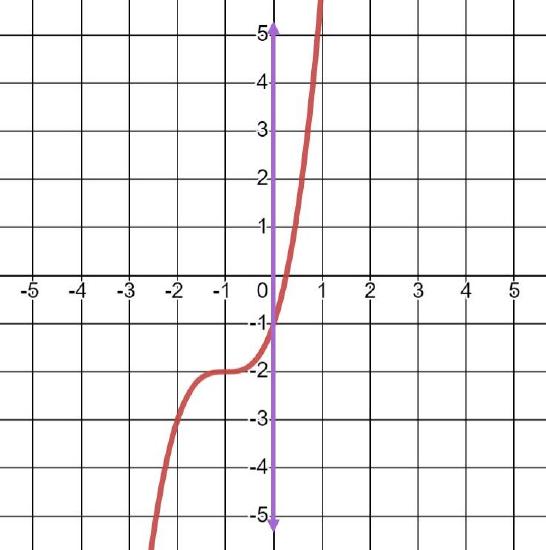
Use the vertical line test to determine if the following graphs represent functions.
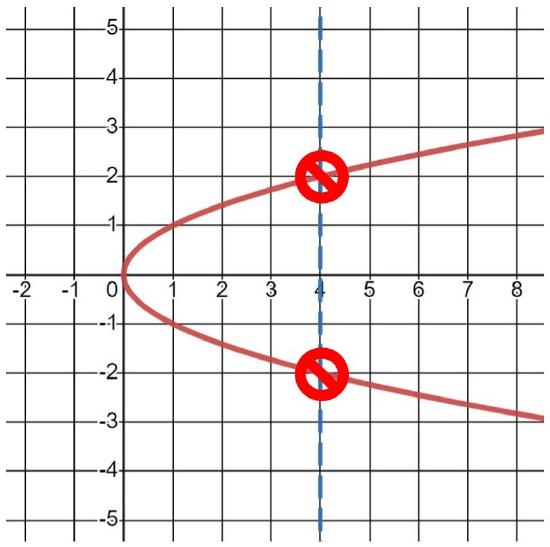
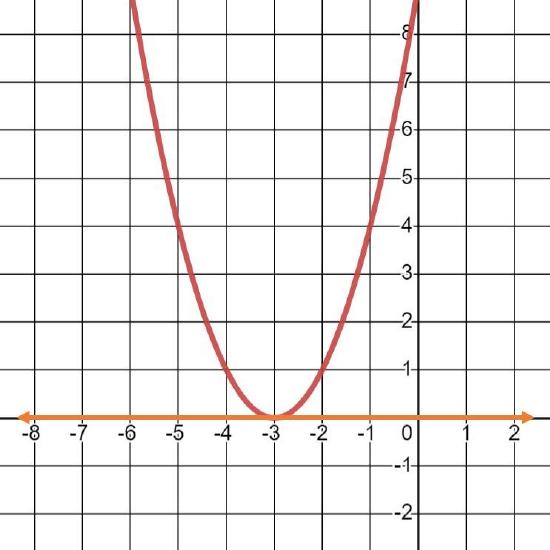
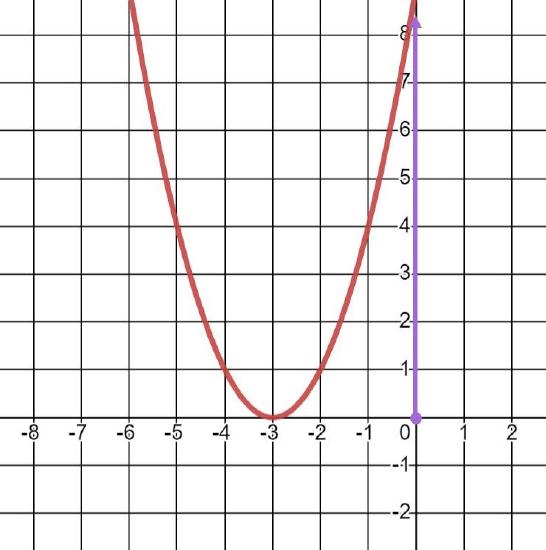
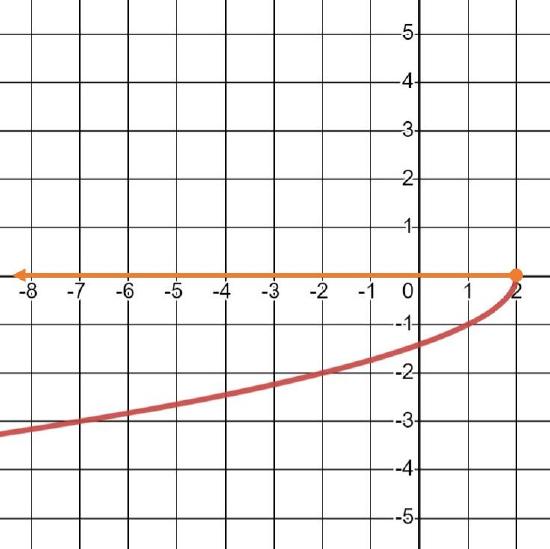
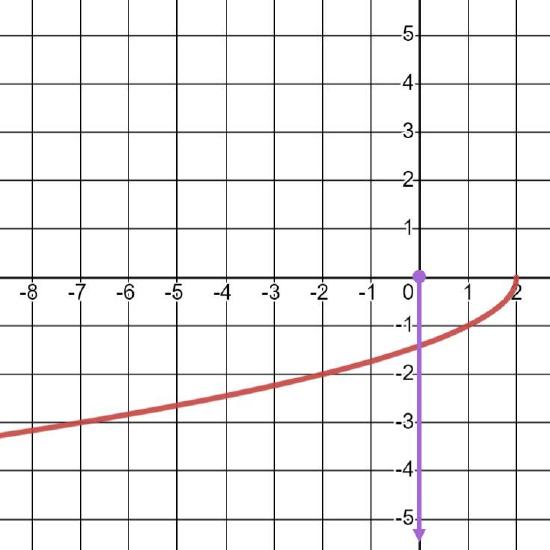
Use the vertical line test to determine if the following graphs represent a function:
We conclude this section by looking at how domain and range appear on a graph. First, let's look at definitions for the domain and range of a function that will be more helpful to us here. These definitions are the same as the ones that we used before, just restated for this context:
The domain of a function is the collection of all possible inputs (or \(x\) values) for the function.
The range of a function is the collection of all possible outputs (or \(y\) values) for the function.
This means that to determine the domain and range of a function using a graph, we just need to look at what is happening along the \(x\) and \(y\) axes. The values along the \(x\) axis that are included on the graph create the domain of the function, while the values along the \(y\) axis that are included on the graph create the range of the function. Let's look at some examples.
For each graph below, determine the domain and range of the function it represents.
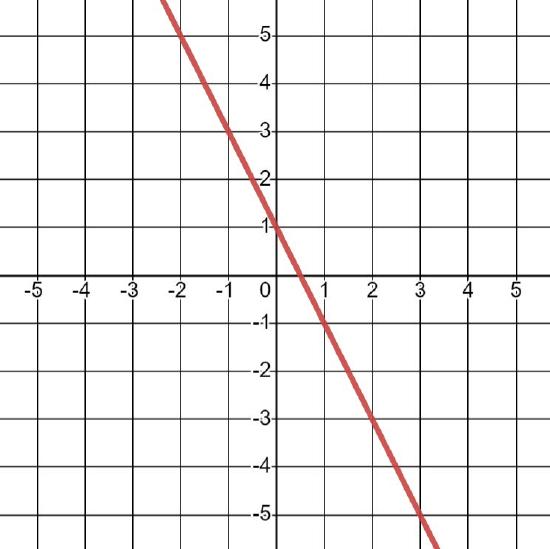
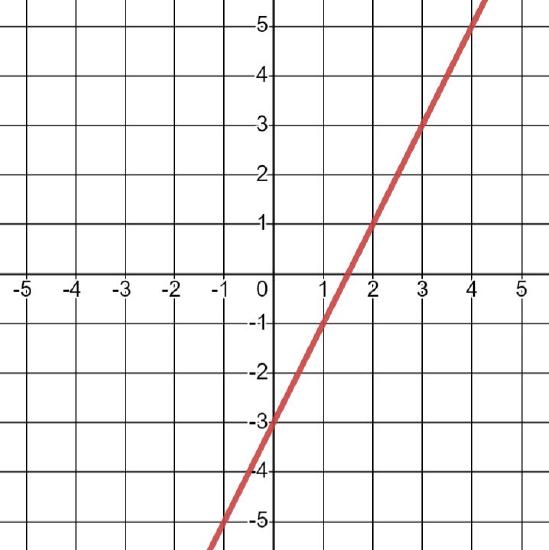
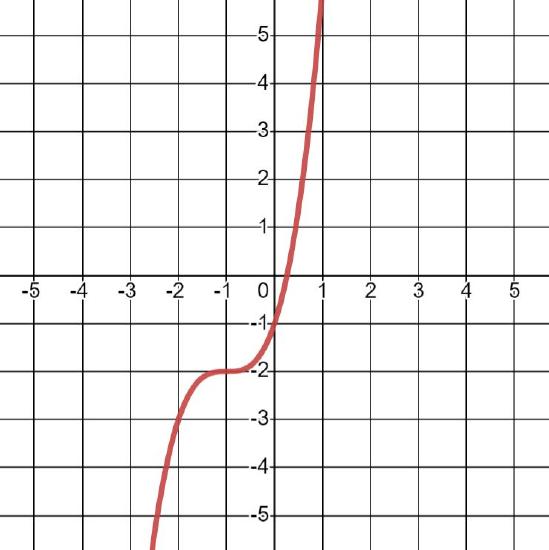
To determine the range, we look at all the possible \(y\) values that the graph can reach. The graph will continue growing both upwards and downwards without end, so the range is all real numbers, that is, \(R = (-\infty, \infty)\) .
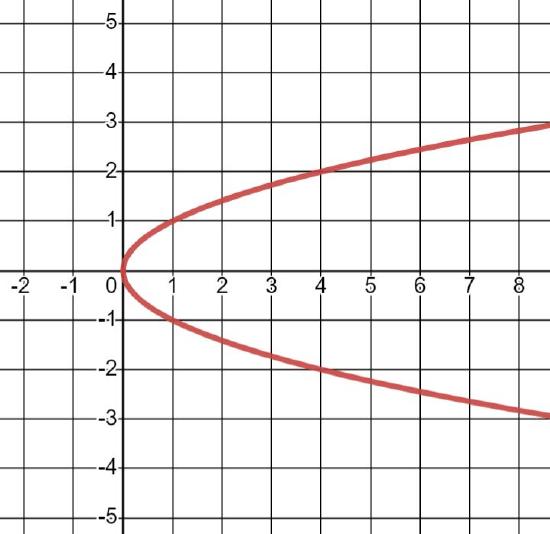
Looking in the vertical direction to determine the range, the graph starts at \(y = 0\) and grows upward toward infinity, so it will hit all \(y\) values that are greater than or equal to 0. Therefore, the range will be \(y \geq 0\).
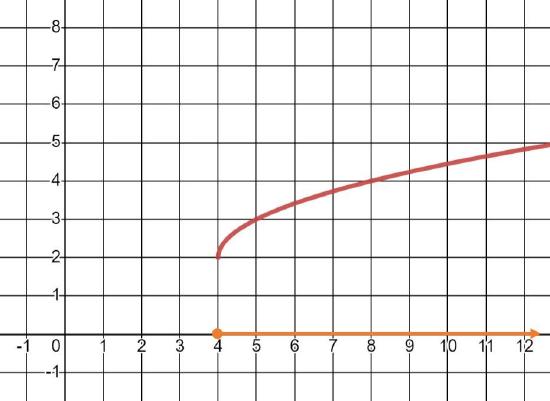
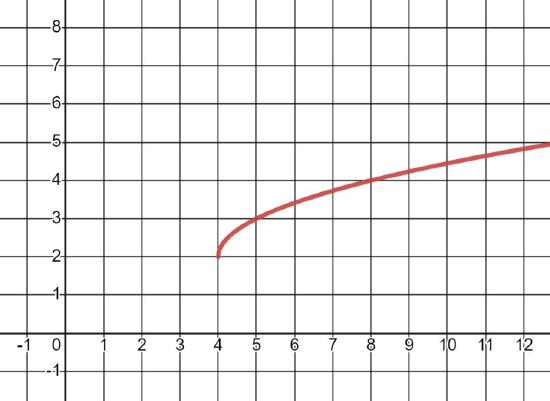
For the range, we look in the vertical direction. The \(y\) values start at \(y = 2\), and even though the graph appears to be more horizontal than vertical, there is no limit on how much it is going to grow (even though it looks like it's slowing down!). Therefore, the possible output values are the \(y\) values that are greater than or equal to 2. Therefore, the range is \(y \geq 2\).
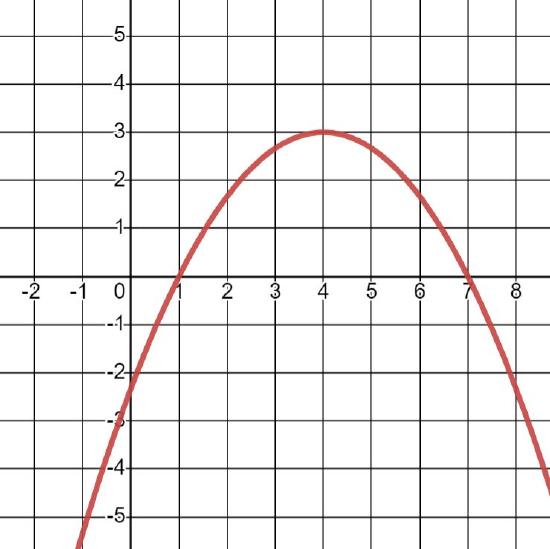
For each graph below, determine the domain and range of the function it represents.
Answer
Add texts here. Do not delete this text first.
To determine the range, we look at all the possible \(y\) values that the graph can reach. The graph will continue growing both upwards and downwards without end, so the range is all real numbers, that is, \(R = (-\infty, \infty)\) .
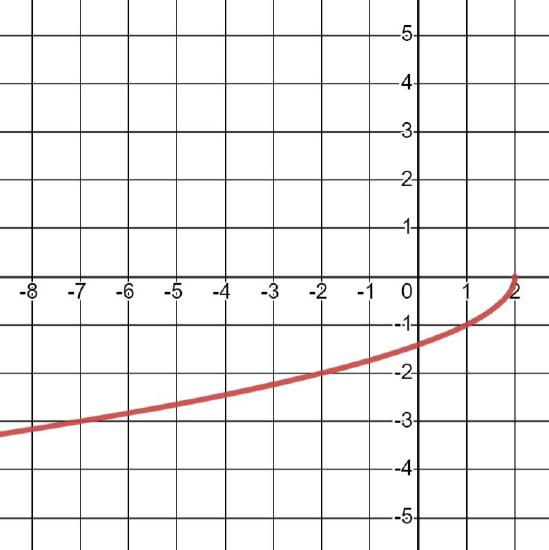
For the range, we look in the vertical direction. This graph starts at \(y = 0\) and goes downward. Similar to the graph in the last example, it appears to be more horizontal than vertical. However, it will continue downward without stopping, so the range will include all the negative \(y\) values and 0. That is, the range is \(y \leq 0\).
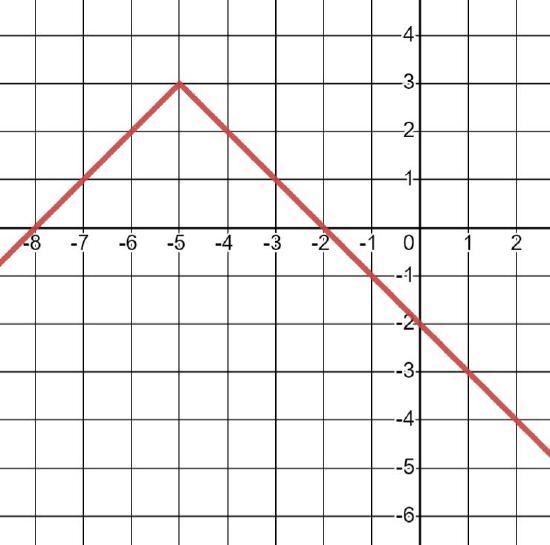
For the range, the \(y\) values begin at \(y = 3\) and then continue downward without stopping. The range is therefore any \(y\) values that are less than or equal to 3. In other words, the range is \(y \leq 3\).
This page titled 2.3: Understanding Graphs of Functions is shared under a CC BY-NC-SA 4.0 license and was authored, remixed, and/or curated by Stanislav A. Trunov and Elizabeth J. Hale.